Every year, hundreds of thousands of new businesses open their doors. The conversation around US startups tends to swing between two extremes: overnight unicorn stories and bleak warnings that almost everyone fails. The reality sits somewhere in the middle. Whether you are a founder deciding to leave a steady salary or an investor sizing up risk, you need evidence rather than folklore. This guide breaks down what public data reveals about how US startups survive, stall, and shut down.
A quick note on method: the figures below are rounded and drawn from the Bureau of Labor Statistics (BLS), CB Insights post-mortem research, and academic work on venture-backed firms. Definitions differ between sources, so treat each number as a range rather than a verdict, and check the latest releases before quoting them elsewhere.
How Many US Startups Fail? The Headline Numbers
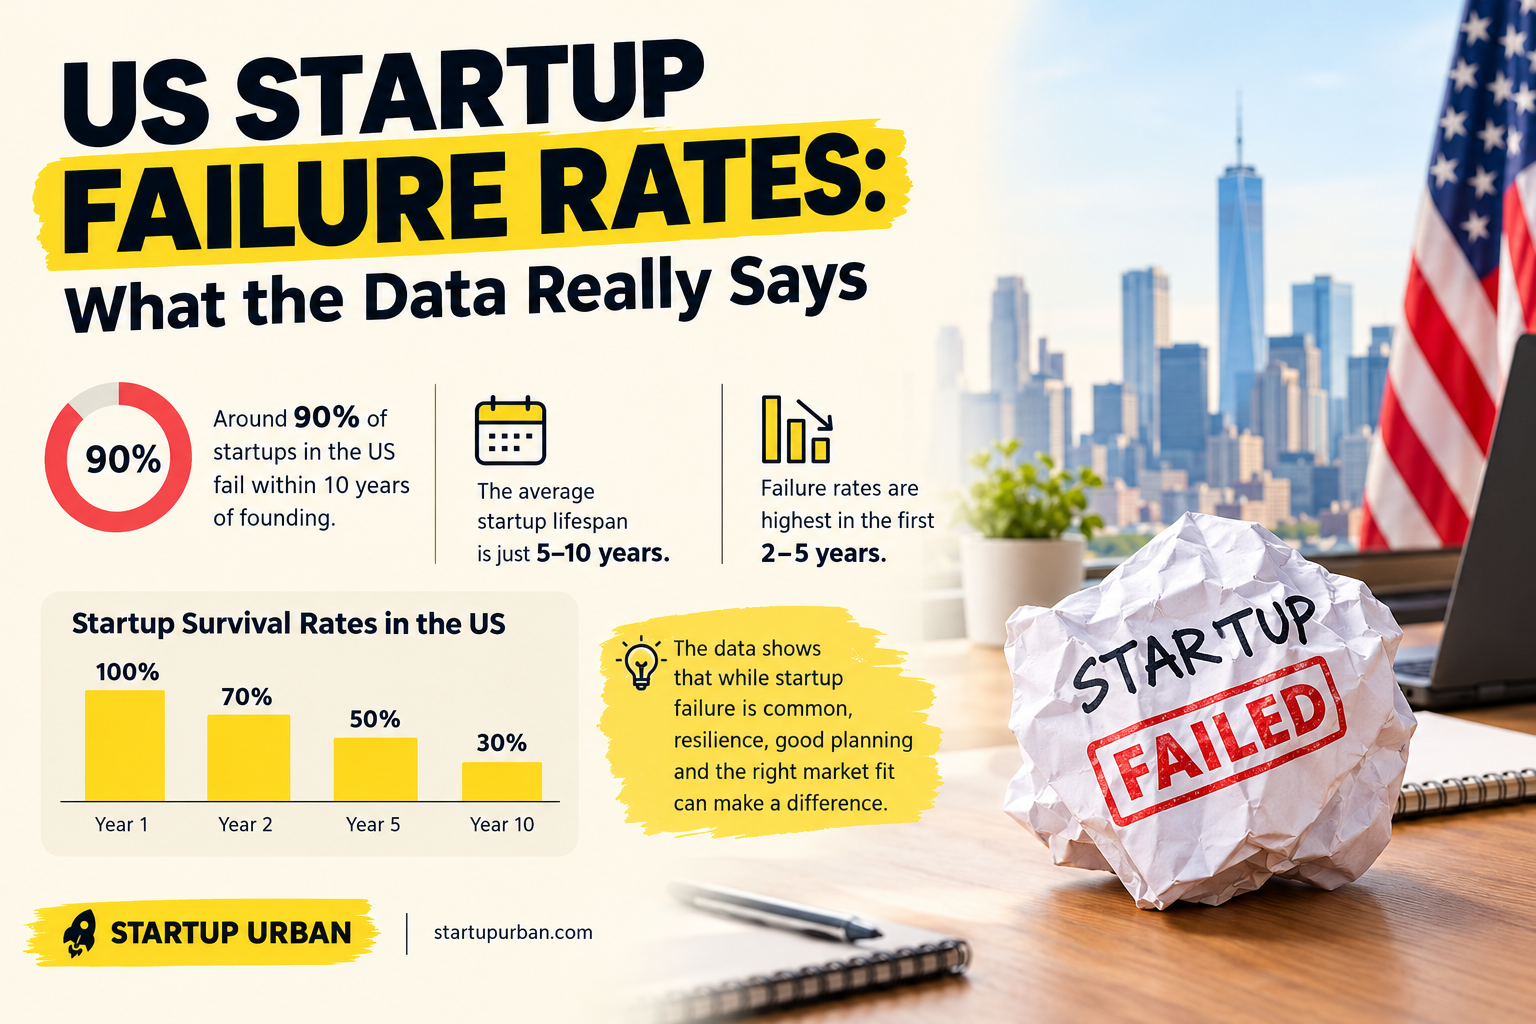
The most widely used dataset comes from the BLS Business Employment Dynamics program, which follows private-sector businesses from the year they open. Roughly one in five closes within twelve months. By year five, about half are gone, and by year ten only around a third remain. These figures cover every new employer business, from corner cafés to software companies, so they are a baseline rather than a prediction for any single venture. Even so, they offer the clearest picture of the survival odds facing US startups.
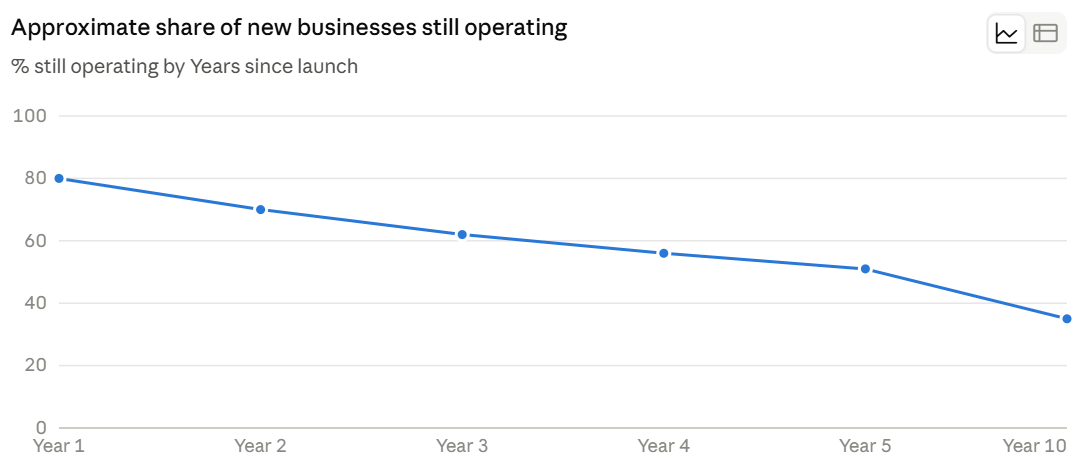
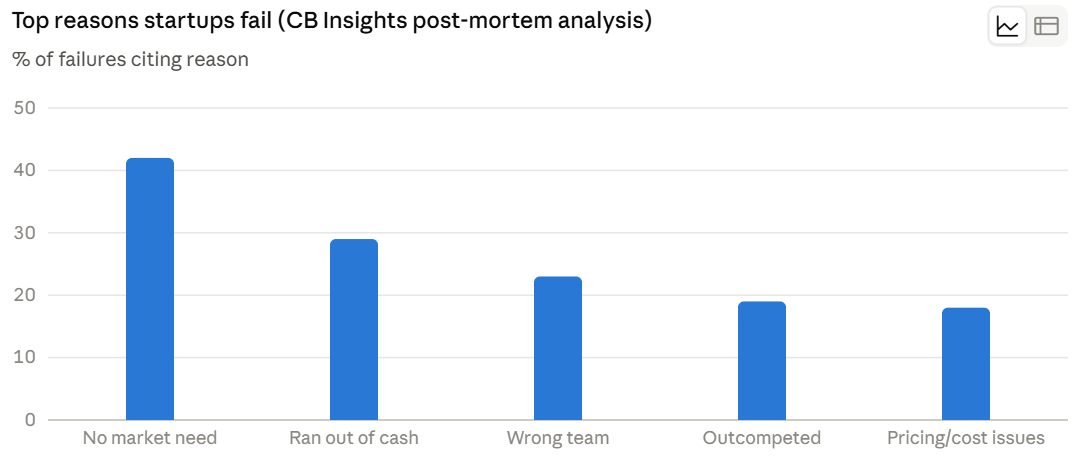
Table 3: Why US startups fail, and the lesson in each reason
| Reason | Share of failures | Practical lesson |
|---|---|---|
| No market need | ~42% | Validate demand before building |
| Ran out of cash | ~29% | Plan 18–24 months of runway |
| Wrong team | ~23% | Balance skills and resolve conflict early |
| Outcompeted | ~19% | Differentiate and watch rivals |
| Pricing or cost problems | ~18% | Know your unit economics |
The leading cause is not weak technology or bad luck. It is building something people do not urgently want. Cash problems usually follow, because a product without demand struggles to raise follow-on funding. For investors, this means customer evidence deserves more weight than founder charisma. For founders, talking to buyers before writing code remains the cheapest insurance available to US startups.
Failure Rates by Industry
Sector matters. BLS data generally show healthcare and education services holding up better, while retail, hospitality, and some information businesses see sharper early losses. Technology-focused US startups face an added twist: outcomes are wide-ranging, with a few enormous winners and a long tail of quiet shutdowns.
Table 4: Relative survival of US startups by sector (qualitative, BLS trends)
| Sector | Relative survival | Why |
|---|---|---|
| Healthcare and education services | Higher | Steady, recurring demand |
| Professional and business services | Around average | Low capital needs, moderate competition |
| Retail and hospitality | Lower | Thin margins, high fixed costs |
| Information and technology | Mixed | Huge variance between winners and losers |
How Economic Cycles Change the Picture
Failure is not constant over time. When money is cheap and funding rounds are easy, weak ideas stay alive longer. When interest rates rise and investors tighten, those companies hit the wall together. Carta’s platform data showed startup shutdowns climbing after 2022 as the funding boom cooled, a reminder that many failures were delayed rather than avoided. For founders, this means your survival odds depend partly on the market you launch into and the market you will need to raise in 18 months. Building a business that can reach profitability, or at least extend runway on its own revenue, reduces exposure to funding cycles you cannot control.
Survival Odds by Funding Stage
For venture-backed companies, risk is staged. Data from cap-table platforms such as Carta has repeatedly shown that only a minority of seed-stage companies raise a Series A within two years, and each later round filters the field again. Investors tracking US startups should treat graduation rates between stages as a core metric, not an afterthought. A company that raised a seed round in a hot market and never hit its Series A milestones is not a survivor in any meaningful sense. It is simply postponing its test.
What Surviving US Startups Do Differently
Post-mortems are useful, but survivors teach just as much. Across studies and founder accounts, five habits recur:
- Validate demand before scaling. Successful US startups run customer interviews, pilots, and pre-sales long before hiring a large team.
- Protect runway. Plan for 18 to 24 months of cash, and open fundraising conversations well before the balance runs low.
- Build a complementary team. Many US startups stall because co-founders share the same skills and blind spots.
- Know your unit economics. Pricing and cost problems sink otherwise promising US startups once growth subsidies fade.
- Pivot on evidence. Founders who last treat strategy as a hypothesis, changing course when data demands it rather than when morale dips.
Practical Takeaways for Founders
If you are building one of the next generation of US startups, use the data this way:
- Spend your first 90 days proving that a specific customer will pay for a specific problem solved.
- Track retention and cash burn weekly. These two numbers explain most early failures.
- Raise money when you have momentum, not when you are desperate. Desperation weakens negotiating power for US startups of any size.
- Keep a written list of the assumptions your business depends on, and test the riskiest one first.
Practical Takeaways for Investors
Reading the numbers well is part of the job when you back US startups:
- Separate closure rates from capital-loss rates. They measure different risks.
- Ask for cohort retention data and customer references before debating valuation.
- Model portfolios on power-law returns. Because most US startups return little, a handful of winners must carry the fund.
- Weigh founder resilience and learning speed as heavily as the pitch deck.
Frequently Asked Questions
What percentage of US startups fail in the first year?
About 20 percent of new businesses close within twelve months, according to BLS-based figures, so roughly four in five US startups make it through year one.
Do most US startups fail within five years?
About half of new businesses do. Venture-backed companies show a different risk profile, with many failing to return investor capital even when they stay open, so the answer depends on how you define failure.
Which sectors are riskiest for US startups?
Retail and hospitality tend to see steeper early losses, while technology shows the widest spread between huge wins and quiet shutdowns. Healthcare and education services generally survive longer.
Conclusion: Failure Is Common, Not Inevitable
The data do not say that starting a company is foolish. They say it is risky in predictable ways. About half of new businesses survive five years, venture-backed outcomes are heavily skewed toward a few winners, and the dominant causes of collapse are missing demand, cash shortages, and team strain. Each of these is at least partly controllable. Founders who validate early, manage runway, and stay honest with themselves improve their odds, and investors who read the evidence carefully allocate capital better. The numbers should inform ambition, not extinguish it. Understanding failure is the first step toward building one of the US startups that last.